The following results were attained from Study One as described. Study One
The experiment was designed to explore the negativity gradient postulate from the evaluative space model using two distincts sets of data. The first dataset consists of behavioural data that characterised movements and selection of actions as participants experienced increased threat between the three levels of the virtual environment. The second set of data are psychophysiological and include fEMG (corrugator, zygomaticus) and SCL. These data are event-related and refer to specific periods of action, which were: (a) risk assessment, i.e. one-foot checks to evaluate whether the block would crack or not, and (b) risk decisions, i.e. two-footed commitment to a block which was either solid or cracked.
In addition, the study was designed to investigate individual differences in trait neuroticism. All participants completed the OCEAN scale (O’Keefe, Kelloway, and Francis 2012) prior to the study. The median score on the trait neuroticism scale was 24 and this was used to create two groups of high vs. low neurotics. Two participants scored 24 on the neuroticism scale and were omitted from further analyses, leaving 15 participants in each group. The High Neuroticism (HN) group had a mean score of 29.94 (s.d. = 3.87) whereas the mean for the Low Neuroticism (LN) group was 17.94 (s.d.=3.71). A between-groups t-test was performed on these data to assess the difference between the two groups and trait neuroticism was significantly higher for the HN group [t(30)=8.95, p<.01].
During the study the position of five points on a participants body were tracked using the HTC VIVE headset, it’s two hand controllers and two foot trackers. The position of these devices on the participants body allowed for analysis of exactly where are participant was throughout the study. Study One Tracking Details
Custom C++ plugins were developed and used in the Unreal Engine based VE to also track precise timings for key interactions e.g. When a level is completed or which type of block was stepped on and when it was stepped on.
Median split on Neuroticism
In addition, the study was designed to investigate individual differences in trait neuroticism. All participants completed the OCEAN scale (O’Keefe, Kelloway, and Francis 2012) prior to the study. The median score on the trait neuroticism scale was 24 and this was used to create two groups of high vs. low neurotics. Two participants scored 24 on the neuroticism scale and were omitted from further analyses, leaving 15 participants in each group. The High Neuroticism (HN) group had a mean score of 29.94 (s.d. = 3.87) whereas the mean for the Low Neuroticism (LN) group was 17.94 (s.d. = 3.71). A between-groups t-test was performed on these data to assess the difference between the two groups and trait neuroticism was significantly higher for the HN group [t(29.95) = 8.95, p <.01].
Behavioural Data
1. Timings
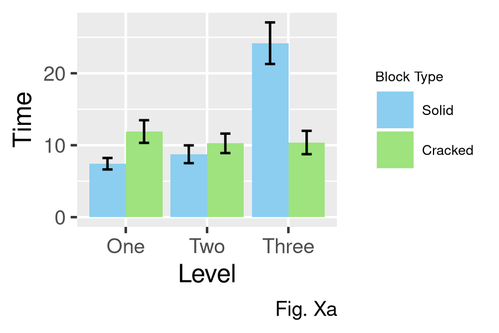
The average time spent by participants standing on each type of block (solid or cracked) was measured and subjected to a 2 (High/Low Neuroticism) x 3 (Level) x 2 (Block type) ANOVA. 10 participants were dropped from the data set as they did not interact with both Solid and Cracked Block types on all of the three Levels. There was a main effect for Level [F=(2, 32) = 14.54 , p = <.0001, eta2 = .48], participants spent longer on average on each block at Level 3 (M = 17.09, SE = 1.56) compared to either Level 1 (M = 9.76, SE = 1.56) or Level 2 (M = 9.6, SE = 1.56). There was also a significant effect for Block type, participants spent longer on solid blocks (M = 13.39, SE = 1.36) compared to cracked blocks (M = 10.91, SE = 1.36). A significant interaction between Level x Block type was also found [F=(2, 32) = 42.12 , p = <.0001, eta2 = .72]; the average time participants spent on Solid blocks was significantly higher than the cracked blocks at Level 3 (i.e. maximum threat level), (see Figure Xa). Post-hoc t-tests were conducted which revealed that participants spent longer standing on Cracked blocks at Level 1 [t(25.21) = -2.54, p 0.02]; this trend was reversed at Level 3 when participants spent longer standing on Solid blocks [t(26.78) = 4.17, p <.001].
2. Frequency of Movement
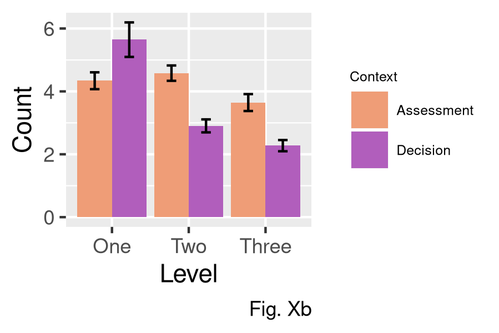
The number of times that each participant interacted with each block was recorded. The Context of these interactions were categorised as risk assessment (testing the block) and risk decision activations (stepping onto the block). This independent variable was included in a 2 (Neuroticism: HN vs. LN group) x 3 (Levels:1,2,3) x 2 (Block type: solid vs. cracked) x 2 (Context: risk assessment vs. risk decision activations) ANOVA. There was a main effect for Context [F=(1, 29) = 11.31 , p = .002, eta2 = .28], participants performed a greater number of risk assessment (one foot) (M = 4.19, SE = 0.18) than risk decision (two feet) interactions (M = 3.61, SE = 0.18). There was also a significant main effect for Block type [F=(1, 29) = 31.28 , p = <.0001, eta2 = .52], participants interacted with Solid blocks (M = 4.46, SE = 0.19) more frequently than Cracked blocks (M = 3.33, SE = 0.19). There was a significant main effect for Level [F=(2, 58) = 56.25 , p = <.0001, eta2 = .66] participants interacted with more frequently with both types of blocks at Level 1 (M = 4.99, SE = 0.19) compared to Level 2 (M = 3.74, SE = 0.19) or Level 3 (M = 2.95, SE = 0.19). The ANOVA also revealed a significant interaction between Context x Level [F=(2, 58) = 49.78 , p = <.0001, eta2 = .63]; post-hoc t-tests revealed that participants made a greater number of risk decision interactions compared to risk assessment interactions, but only during Level 1 (M = 4.35, SE = 0.23). This trend was reversed during Levels 2 (M = 5.64, SE = 0.23) and 3 (M = 4.58, SE = 0.23) as participants increased their frequency of risk assessment checks compared to risk decision movements (see Figure Xb).
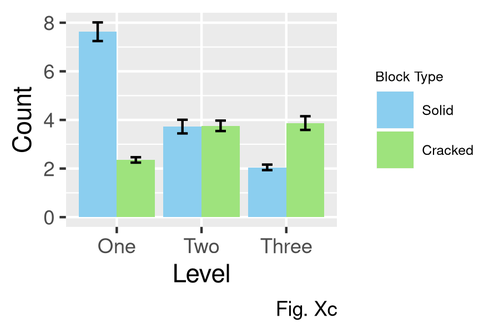
There was also a significant 2-way interaction between Block Type x Level [F=(2, 58) = 177.24 , p = <.0001, eta2 = .86]; post-hoc tests revealed that participants interacted with greater number of Solid blocks (M = 7.62, SE = 0.24) compared to Cracked Blocks (M = 2.37, SE = 0.24) at Level 1. This trend was reversed during Level 3 (M = 2.05, SE = 0.24),(M = 3.86, SE = 0.24), See Fig Xc. This pattern reflects the greater frequency of solid blocks at Level 1 and cracked blocks at Level 3. Study One Layout
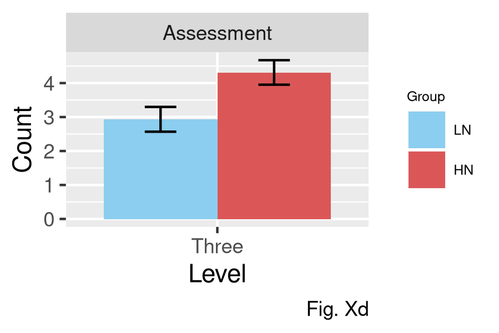
The ANOVA also revealed a significant 3-way interaction between Context x Level x Neuroticism [F=(2, 58) = 3.14 +, p = .05, eta2 = .10]. Subsequent post-hoc t-tests revealed that the HN group (M = 4.32, SE = 0.32) made a significantly greater number of risk assessment activations (i.e. testing the blocks) compared to the LN group (M = 2.94, SE = 0.33) but only during level 3 (See .Fig Xd).
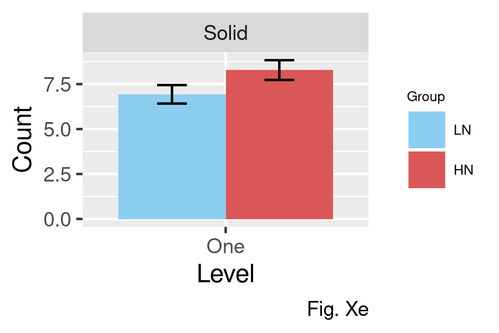
A second significant 3-way interaction was observed between Block Type x Level x Neuroticism [F=(2, 58) = 9.61 , p = .0002, eta2 = .25]. Post-hoc t-tests revealed a higher frequency of interactions with Solid blocks for the HN group (M = 8.29, SE = 0.34) compared to the LN group (M = 6.94, SE = 0.35) at Level 1 (see Fig Xe).
4. Psychophysiology Event Related Analysis
Data was captured via sensors and logged throughout course of each participant trial. Study One Data Analysis
Psychophysiology data was captured in 3000ms windowed time periods. An average score was calculated from the pre-event period. Two post-event periods (0-750ms and 751-1500) after the interaction were then subtracted from the pre-event average to create two post event change scores (Period 1, Period 2).
Period 1 = Average during 0-750ms after Interaction - Pre-Interaction Average Period 2 = Average during 751-1500ms after interaction - Pre-Interaction Period
These two periods of data were then subjected to a 2 (High/Low Neuroticism) x 2 (Context) x 2 (Period) ANOVA.
4.1 SCL
No siginificant effects for SCL
4.1 Corrugator Supercilii
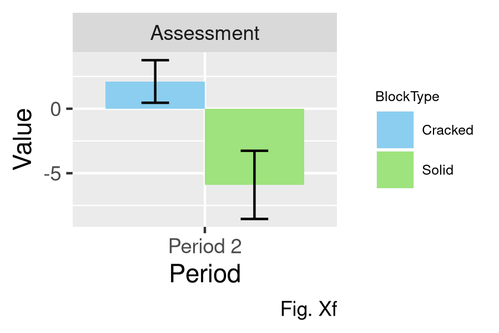
There were no significant main effects. There was a significant interaction effect for Block Type, Context and Period [F=(1, 27) = 5.18 , p = .03, eta2 = .16]; post-hoc t-tests revealed the corrugator was more highly activated during the post-event period for risk assessment actions [t(46.95) = -2.57, p 0.01] on Cracked Blocks (M = 2.08, SE = 3.13) than for the risk assesment post-event period for Solid blocks (M = -5.83, SE = 3.13), see Fig Xf.
4.2 Zygomaticus Major
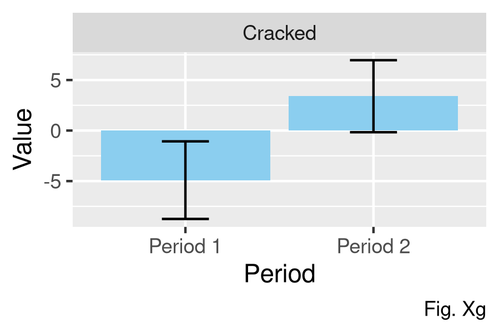
There were no significant main effects. There was a significant effect for Period and BlockType [F=(1, 27) = 5.02 , p = .03, eta2 = .004] and a significant three way interaction between Context, Period and BlockType [F=(1, 27) = 4.59 , p = .04, eta2 = .16]; post-hoc t-tests revealed that the zygomaticus significantly increased between Period 1 and (M = -4.81, SE = 3.34) Period 2 (M = 3.4, SE = 3.34) when the block was cracked irrespective of Context , see Fig Xg.
ANOVA Models
Timings Type III
| Effect | df | MSE | F | pes | p.value |
|---|---|---|---|---|---|
| Group | 1, 16 | 170.61 | 0.62 | .04 | .44 |
| BlockType | 1, 16 | 27.23 | 5.79 * | .27 | .03 |
| Group:BlockType | 1, 16 | 27.23 | 0.30 | .02 | .59 |
| Level | 2, 32 | 43.06 | 14.54 *** | .48 | <.0001 |
| Group:Level | 2, 32 | 43.06 | 0.45 | .03 | .64 |
| BlockType:Level | 2, 32 | 19.02 | 42.12 *** | .72 | <.0001 |
| Group:BlockType:Level | 2, 32 | 19.02 | 0.92 | .05 | .41 |
Frequency Type III
| Effect | df | MSE | F | pes | p.value |
|---|---|---|---|---|---|
| Group | 1, 29 | 9.07 | 5.11 * | .15 | .03 |
| Context | 1, 29 | 2.78 | 11.31 ** | .28 | .002 |
| Group:Context | 1, 29 | 2.78 | 0.05 | .002 | .82 |
| BlockType | 1, 29 | 3.81 | 31.28 *** | .52 | <.0001 |
| Group:BlockType | 1, 29 | 3.81 | 0.97 | .03 | .33 |
| Level | 2, 58 | 2.33 | 56.25 *** | .66 | <.0001 |
| Group:Level | 2, 58 | 2.33 | 0.98 | .03 | .38 |
| Context:BlockType | 1, 29 | 0.91 | 129.27 *** | .82 | <.0001 |
| Group:Context:BlockType | 1, 29 | 0.91 | 3.68 + | .11 | .06 |
| Context:Level | 2, 58 | 1.65 | 49.78 *** | .63 | <.0001 |
| Group:Context:Level | 2, 58 | 1.65 | 3.14 + | .10 | .05 |
| BlockType:Level | 2, 58 | 2.36 | 177.24 *** | .86 | <.0001 |
| Group:BlockType:Level | 2, 58 | 2.36 | 4.92 * | .15 | .01 |
| Context:BlockType:Level | 2, 58 | 2.12 | 9.61 *** | .25 | .0002 |
| Group:Context:BlockType:Level | 2, 58 | 2.12 | 1.12 | .04 | .33 |
References
- Previous in category: Emotional Responses in Virtual Reality Environments
- Next in category: Behavioural Responses in Virtual Environments